
7 Best BI Tools for Small Businesses in 2026 (Free and Paid, Compared)
7 best BI tools for small businesses compared on price, free plans and ease of use, from free dashboards to $300-a-month platforms. Prices checked Nov 2, 2026.
 Shamim Mia, Founder, SerpAstraLast verified November 2, 202611 min read
We compare pricing pages, documentation and public reviews. We never accept payment for rankings.

Key takeaways
- Zoho Analytics is the best value for most small businesses: a full BI suite with 500+ connectors from $30 a month ($24 billed annually), with a free plan for 2 users.
- Microsoft Power BI ($14 per user a month) and Looker Studio (free) are the cheapest routes in if your data already lives in Microsoft 365 or Google.
- The single most important buying factor is who builds and reads the dashboards: if nobody on the team will build reports, a KPI tool like Databox beats a modeling platform like Tableau.
- Every price below was checked on the vendor's own pricing page on November 2, 2026. Ratings are G2, with review counts shown.
On this page
Quick comparison
| Tool | Best for | Starting price | Free plan |
|---|---|---|---|
| Zoho Analytics | Small businesses already using Zoho apps, or any small team that wants a full BI suite for a flat $30 a month | $30/mo | Yes (2 users) |
| Microsoft Power BI | Small businesses on Microsoft 365 that need to share reports with the whole team | $14/user/mo | Yes (no sharing) |
| Looker Studio | Small businesses that live in Google Sheets, Analytics and Ads and want dashboards for free | Free | Yes (free) |
| Databox | Small marketing and sales teams that want live KPI dashboards without building data models | $89/mo | Yes (1 user) |
| Tableau | Small businesses with one analyst who needs the best interactive visualizations | $75/user/mo | No (14-day trial) |
| Qlik Sense | Small teams with messy, related data who need to explore freely rather than follow fixed reports | $300/mo | No (30-day trial) |
| Metabase | Small technical teams that want a free, self-hosted BI tool on their own database | $100/mo | Yes (self-hosted) |
Make one of these tools?
We re-check this list every quarter. Send a correction, request a review, or ask about a clearly labeled sponsored spot.
Request a listingThe best bi tools for small businesses

Zoho Analytics
Best for: Small businesses already using Zoho apps, or any small team that wants a full BI suite for a flat $30 a month
Zoho Analytics is the value pick because the entry plan is a complete BI suite, not a taster: 2 users, 500,000 rows, unlimited reports and dashboards, and more than 500 connectors for $30 a month, or $24 on annual billing. A free plan covers 2 users and 10,000 rows, so a very small team can start without paying and upgrade when the data grows.
The Zia AI assistant answers plain-English questions and suggests charts, which is rare at this price, and the native fit with Zoho CRM and Books means sales and accounting data arrive without a connector bill. The ceiling is real, though: 2 users and half a million rows on Basic, and the interface feels plain next to Tableau. For a small business that wants one tool for everything, start here.
What we like
- Flat-rate pricing: Basic covers 2 users and 500,000 rows for $30 a month, with unlimited reports and dashboards
- More than 500 data connectors, including spreadsheets, accounting tools, CRM and marketing apps
- Zia, the built-in AI assistant, answers questions in plain English and suggests charts
- Native fit with Zoho CRM, Books and other Zoho apps small businesses already use
Watch out for
- Basic is capped at 2 users and 500,000 rows, so a growing team jumps to Standard at $60 a month
- Advanced AI features and white-label reporting sit on the higher plans

Microsoft Power BI
Best for: Small businesses on Microsoft 365 that need to share reports with the whole team
Power BI is the cheapest way to share real BI if your team already lives in Microsoft 365: Pro costs $14 per user a month on annual billing, and the free Desktop app builds reports for one person at no cost. It connects to Excel, SharePoint, Teams and hundreds of other sources, and DAX modeling handles calculations that break a spreadsheet.
The catch is the viewer rule: everyone who reads a shared report needs a Pro license too, unless the workspace sits on Fabric capacity, so a 10-person team pays $140 a month before anyone builds anything. Premium Per User at $24 adds Copilot AI and 100 GB models. If your data lives in Excel and your team in Teams, this is the obvious pick.
What we like
- Deep integration with Excel, Teams and SharePoint, plus hundreds of data connectors
- Strong data modeling with DAX, scheduled refreshes up to 8 times a day on Pro
- Included in Microsoft 365 E5, so some teams already own it
Watch out for
- Every viewer needs a $14 Pro license unless the workspace sits on Fabric capacity
- Copilot AI and large models need Premium Per User at $24 a month, not Pro

Looker Studio
Best for: Small businesses that live in Google Sheets, Analytics and Ads and want dashboards for free
Looker Studio is the free pick, and for many small businesses it is the only BI tool they will ever need: the core product costs nothing for creators and viewers, with no user limits, and it connects natively to Sheets, Analytics, Ads, BigQuery and Search Console. Google renamed it Data Studio in April 2026, but the product, the free tier and the $9 Pro add-on are unchanged.
The trade-off is depth. There is no real data preparation or modeling, so messy data must be cleaned before it arrives, and dashboards slow down on large datasets while third-party connectors often cost extra. Pro adds team workspaces, organization-owned reports and Gemini AI for $9 per user per project a month. If your data already lives in Google, start here and pay nothing.
What we like
- Completely free core product with no user limits, including sharing and scheduled email delivery
- Native connectors for Google Sheets, Analytics, Ads, BigQuery and Search Console
- Pro adds team workspaces, organization-owned reports and Gemini AI for $9 per user per project each month
Watch out for
- No real data preparation or modeling: messy data has to be cleaned before it arrives
- Dashboards slow down with large datasets, and third-party connectors often cost extra

Databox
Best for: Small marketing and sales teams that want live KPI dashboards without building data models
Databox is the fastest route from scattered marketing tools to one live dashboard: pick metrics from more than 130 integrations, pick a template, and the dashboard is live without building a data model or writing SQL. The free plan covers 1 user and 3 data sources, and Analyst costs $89 a month, or $71 on annual billing, for 1 user and 5 sources with hourly sync.
Genie, the built-in AI analyst, answers plain-language questions on every plan, including the free one, and dashboards can be pushed to TV screens, Slack or email on a schedule. The limits bite fast, though: Analyst covers a single user, so a real team pays $199 a month for Team Core, and every extra data source adds to the bill. Buy it for KPI tracking, not for deep analysis.
What we like
- More than 130 native connectors for marketing, sales and finance tools, with ready-made templates
- Dashboards update automatically and can be pushed to TV screens, Slack or email
- Genie, the built-in AI analyst, answers plain-language questions on every plan, including the free plan
- No data modeling needed: pick metrics, pick a template, and the dashboard is live
Watch out for
- Analyst covers only 1 user and 5 data sources, so a team pays $199 a month for Team Core
- Extra data sources and white-labeling cost extra, so the bill grows with every tool you connect

Tableau
Best for: Small businesses with one analyst who needs the best interactive visualizations
Tableau still sets the standard for visual exploration: drag-and-drop dashboards that invite clicking, filtering and drilling into the data, backed by connections to almost any source. Creator costs $75 per user a month on annual billing and includes Desktop and Prep Builder, while Viewers cost $15 a month each, so a team of one builder and five readers pays $150 a month.
The price is the honest problem for a small business: $900 a year for one Creator before a single viewer is added, annual billing only, and the AI features live in the quote-only Cloud+ edition. Advanced calculations also take real learning time. If one analyst owns reporting and the business judges tools by the quality of the charts, Tableau earns its price.
What we like
- The strongest drag-and-drop visual exploration in this list, with fast interactive dashboards
- Connects to almost any source, including spreadsheets, databases and cloud warehouses
- Viewer licenses at $15 a month let the rest of the team read dashboards cheaply
Watch out for
- A single Creator costs $900 a year before any viewer is added, and billing is annual only
- Advanced features have a steep learning curve, and AI features need the quote-only Cloud+ edition

Qlik Sense
Best for: Small teams with messy, related data who need to explore freely rather than follow fixed reports
Qlik Sense is built around its associative engine: click any value and every chart, table and figure on the dashboard reacts, which makes exploring messy, related data feel natural instead of pre-scripted. Cloud Analytics Starter costs a flat $300 a month for 10 users and 10 GB of data, billed annually, so adding viewers inside that bundle costs nothing extra.
Insight Advisor suggests charts and answers plain-English questions, and scheduled reloads keep the data fresh without manual exports. The limits are the flat model itself: 10 GB of data for analysis cannot be expanded within Starter, and there is no permanent free plan, only a 30-day trial. Choose Qlik when exploration matters more than fixed monthly reports.
What we like
- Associative engine lets users click any value and see how every other figure changes
- Insight Advisor suggests charts and answers plain-English questions about the data
- Flat $300 a month covers 10 users, so adding viewers does not raise the bill
Watch out for
- No permanent free plan, and the 10 GB data allowance on Starter cannot be expanded within the plan
- The interface takes longer to learn than the simpler dashboard tools in this list

Metabase
Best for: Small technical teams that want a free, self-hosted BI tool on their own database
Metabase is the open-source pick: the self-hosted edition is free forever with no user or dashboard limits, and the visual query builder lets non-technical staff ask questions of a database without writing SQL. Cloud Starter costs $100 a month for 5 users, or $90 on annual billing, and removes hosting, upgrades and backups for teams that would rather not run a server.
The free edition is genuinely capable, but self-hosting means your team owns security, upgrades and backups, including patching after a vulnerability. The paid tiers also jump steeply: SSO, row-level permissions and white-labeling need Pro at $575 a month. Pick Metabase if your data already lives in a database and someone technical can own the server.
What we like
- Open-source edition is genuinely free to self-host, with no user or dashboard limits
- Visual query builder lets non-technical staff ask questions without writing SQL
- Cloud Starter at $100 a month removes hosting, upgrades and backups for small teams
Watch out for
- Self-hosting means your team owns security, upgrades and backups, including patching
- SSO, row-level permissions and white-labeling need Pro at $575 a month
The best BI tools for small businesses turn scattered spreadsheets, invoices and marketing numbers into one dashboard the whole team can read. This list ranks seven tools by fit for a typical small business, from free dashboards to $300-a-month platforms, with every price checked on the vendor's own pricing page on November 2, 2026.
How to choose the best BI tools for small businesses
A BI tool fails quietly when it does not match the team using it, so choose around the people first and the features second. A tool with the best charts in the world is worthless if the only person who can build a report leaves, so weigh ease of use as heavily as power. Work through these six factors before you compare prices.
- Start with where your data lives. Google data points to Looker Studio, Microsoft 365 to Power BI, Zoho apps to Zoho Analytics; matching the stack saves connector fees and setup time.
- Count builders and viewers separately. Per-user tools charge for every reader, so a cheap builder price can hide a big team bill; flat-rate tools like Zoho and Qlik do not.
- Check the free plan's real limits. Free usually means capped users, rows or data sources, and Power BI's free license cannot share reports at all.
- Match the tool to the builder. If nobody will build reports, a template tool like Databox beats a modeling platform like Tableau, however good its charts are.
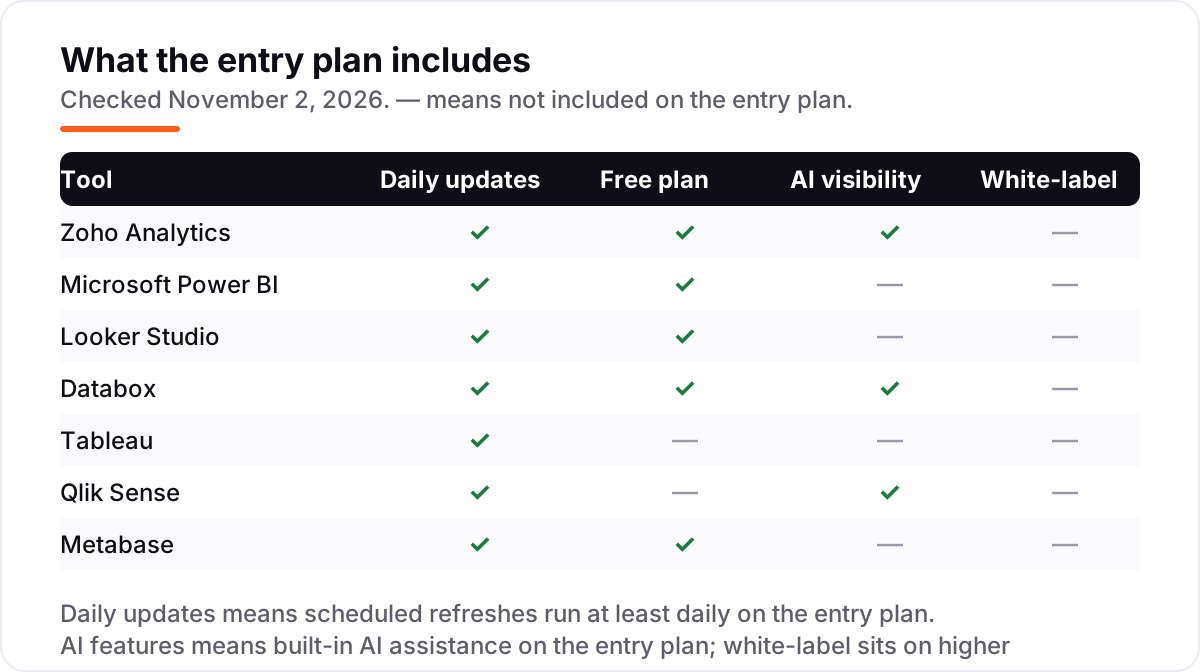
- Ask how data stays fresh. Daily refresh is the minimum for a dashboard anyone trusts; hourly or live queries matter for sales and support teams.
- Price the tool at your size in six months. Extra users, rows and data sources are where BI bills grow, so check the next tier before you commit.
The cheapest mistake is buying for the person who demos the tool instead of the person who maintains it. A founder who loves Tableau's charts but never builds a dashboard will get less value than a team that actually opens Zoho every morning, so ask who will own the tool on week six, not just who signs the contract. If the answer is nobody, pick the simplest tool that covers your top three reports and revisit the decision when the questions get harder.
Quick comparison: tool type by need
| Buyer | Best pick | Why |
|---|---|---|
| Solo owner, Google data | Looker Studio | Free, no user limits, native Google connectors |
| Small team, best value | Zoho Analytics | Full suite from $30 a month flat, 500+ connectors |
| Microsoft 365 team | Microsoft Power BI | $14 per user a month, deep Excel and Teams fit |
| Marketing KPIs, no SQL | Databox | Live KPI dashboards from $89 a month, 130+ integrations |
| One analyst, best charts | Tableau | Strongest visual exploration, Creator $75 a month |
| Exploring messy data | Qlik Sense | Associative engine, flat $300 a month for 10 users |
| Database team, self-hosted | Metabase | Free open-source edition, Cloud Starter $100 a month |
BI tools pricing: what you will actually pay
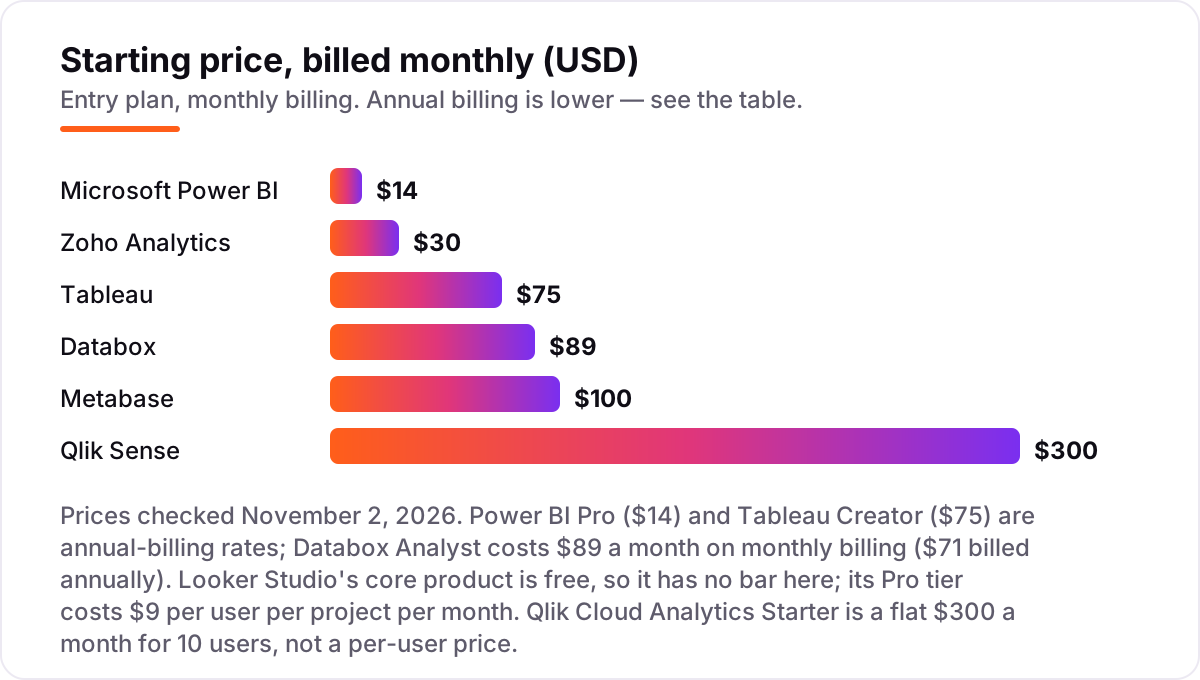
Take a 5-person team that needs one builder and four viewers. On Zoho Analytics, Basic covers 2 users for $30 a month, so the team needs Standard at $60 a month for 5 users and 5 million rows. On Power BI, 5 Pro licenses cost $70 a month, and every viewer pays the same $14. On Tableau, 1 Creator at $75 plus 4 Viewers at $15 comes to $135 a month, billed annually. On Qlik Sense, the flat Starter bundle covers all 10 users for $300 a month. On Databox, Analyst covers 1 user for $89 a month, so the team needs Team Core at $199 a month. Looker Studio costs nothing for the same five people, and Metabase Cloud Starter covers 5 users for $100 a month.
The annual totals for the same 5-person team tell the same story in bigger numbers: Zoho Standard $720 a year, Power BI $840, Tableau $1,620, Qlik Sense $3,600, Databox Team Core $2,388, Metabase Starter $1,200, Looker Studio $0. Those totals assume annual billing where the vendor offers it; month-to-month billing costs more. The cheapest tool on the shelf is rarely the cheapest at your team size, so run this math with your own headcount before you buy.
Watch for the costs that sit outside the headline price. Third-party connectors can add a monthly fee per source on the free and cheaper plans, and several tools charge extra for white-label reports, faster refreshes or additional data capacity. Power BI is the sharpest example: the $14 license looks cheap until every viewer needs one, which is why a capacity plan can beat per-user billing once the audience grows past a few hundred readers. Ask each vendor for the full first-year total at your user count and data volume, in writing, before you sign an annual contract.
KPI dashboards vs full BI platforms: know the difference
The biggest buyer confusion in this category is the line between a dashboard tool and a BI platform. A dashboard tool like Databox connects to your apps and shows their numbers in templates: fast to set up, easy to read, and limited to the metrics the connector provides. A BI platform like Power BI, Tableau, Qlik Sense or Zoho Analytics also cleans, joins and models data, so you can combine sales, marketing and finance figures and ask questions nobody pre-built a chart for. The trade is effort: dashboard tools are live in an afternoon, while BI platforms need someone to build and maintain the model.
If the question is "how did we do this week," a dashboard tool is enough. If the question is "why did it change," you need a BI platform, because only a modeled dataset can trace a dip back to the campaign, product or region behind it. Buy the dashboard tool first if you are unsure; you can graduate to a platform when the questions outgrow the templates, and by then you will know exactly which data sources matter.
A quick test settles which side you are on: write down the five questions you ask about the business every week. If all five can be answered by a number from a single app — sales this week, ad spend, new signups, support tickets, cash in the bank — a dashboard tool covers you. If any question needs two sources joined together, like revenue per campaign or margin by product line, you need the modeling layer of a BI platform. Most small businesses start with the first list and grow into the second within a year, which is why starting cheap and switching later is a reasonable plan rather than a mistake.
How we chose
We checked each vendor's own pricing page on November 2, 2026 and recorded the starting price exactly as shown, including the annual-billing figure where the page lists one. Ratings come from G2, with the review count and the date checked on each card. Free plans were checked the same way: every free tier named in this guide exists on the vendor's own pricing or product page, with its limits stated on the card. Two prices need a note: Databox lists Analyst at $89 a month on monthly billing and $71 billed annually, and Qlik's current pricing page sells Cloud Analytics Starter as a flat $300 a month for 10 users rather than the per-user Business plan older directories still show. We ranked the tools by fit for the most common buyer — a small business owner who wants shared dashboards without hiring a data team — not by brand size. No vendor paid for a place in this list, and none of the links here are affiliate links.
What to do next
Start with the decision path above: find where your data lives, count builders and viewers, and try the free plan or trial of your top pick with your real data for a week. During the trial, connect the three sources you check most often and build the one report you actually open every Monday; if that report stays fresh and the numbers match your spreadsheets, the tool can be trusted with the rest. If the dashboards stay fresh and the reports make sense to the people who must act on them, you have your tool. If the numbers point to a traffic or visibility problem instead of a reporting one, an SEO audit will show what is actually wrong. Before you publish new pages for the keywords you track, run your campaign links through the free UTM builder so traffic is tagged cleanly for the dashboards you just built. Once your tools are in place, find out what's holding your rankings back.
Your stack only works if people find you
SerpAstra fixes what keeps your site off page one and makes it easy for AI assistants to recommend.
Get a free audit→Sources we checked (14)
- Zoho Analytics pricing — zoho.com/analytics/pricing.html (checked November 2, 2026)
- Zoho Analytics on G2 — 4.2/5, 290 reviews (checked November 2, 2026)
- Microsoft Power BI pricing — microsoft.com (checked November 2, 2026)
- Microsoft Power BI on G2 — 4.5/5, 1,658 reviews (checked November 2, 2026)
- Looker Studio — lookerstudio.google.com (checked November 2, 2026)
- Looker Studio on G2 — 4.4/5, 476 reviews (checked November 2, 2026)
- Databox pricing — databox.com/pricing (checked November 2, 2026)
- Databox on G2 — 4.4/5, 194 reviews (checked November 2, 2026)
- Tableau pricing — tableau.com/pricing (checked November 2, 2026)
- Tableau on G2 — 4.4/5, 4,235 reviews (checked November 2, 2026)
- Qlik Cloud Analytics pricing — qlik.com/us/pricing (checked November 2, 2026)
- Qlik Sense on G2 — 4.4/5, 929 reviews (checked November 2, 2026)
- Metabase pricing — metabase.com/pricing (checked November 2, 2026)
- Metabase on G2 — 4.4/5, 147 reviews (checked November 2, 2026)
Shamim
Founder of SerpAstra
A full-stack SEO and digital marketer who spends most days on Local SEO for dental practices, AI search visibility and lead generation.
Frequently asked questions
What is the best BI tool for a small business?
Zoho Analytics is the best all-round pick for most small businesses: a full suite with 500+ connectors from $30 a month, with a free plan. If your data lives in Microsoft 365, Power BI at $14 per user is better; if it lives in Google, Looker Studio is free. Pick the tool that matches where your data already sits.
How much does a BI tool cost for a small business?
From $0 to $300 a month at the entry level. Looker Studio and Metabase's open-source edition are free, Zoho Analytics starts at $30 a month, Power BI at $14 per user, Tableau at $75 per user and Qlik Sense at $300 flat for 10 users. Per-user tools cost more as the team grows; flat-rate tools do not.
Is there a free BI tool for small businesses?
Yes. Looker Studio is free with no user limits if your data is in Google tools, and Metabase's open-source edition is free to self-host with no limits. Zoho Analytics, Power BI and Databox also have free plans, but with caps: 2 users, no sharing and 1 user with 3 data sources respectively.
What is the difference between a BI tool and a dashboard tool?
A dashboard tool shows numbers from your apps, usually with fixed templates and little modeling. A BI tool also cleans, joins and models data, so you can ask new questions of it instead of reading the same report. Databox is a dashboard tool; Zoho, Power BI, Tableau and Qlik are full BI platforms.
Do I need a data analyst to use a BI tool?
Not for the simpler tools. Databox and Looker Studio are built for non-technical users, with templates and drag-and-drop builders. Power BI and Tableau reward some training, and Qlik and Metabase assume someone comfortable with data. If nobody will build reports, start with Databox or Looker Studio.
Can a BI tool replace spreadsheets?
For reporting, yes. A BI tool pulls live data from your apps and refreshes dashboards automatically, so nobody rebuilds the same spreadsheet every Monday. Spreadsheets still win for one-off analysis and quick calculations. Most small businesses keep both: the BI tool for shared reporting, spreadsheets for ad-hoc work.
Free SEO and AI visibility audit
Find out what is holding your rankings back
Send us your site. Within 2 business days you get a written audit, an AI visibility check and a short fix list ranked by impact. Free, with no contract attached.
Request my free audit→Related guides
 SEO & AI Search12 Best Marketing Platforms for Small Business SEO in 2026, ComparedThe 12 best marketing platforms for small business SEO, compared on real prices, SEO tools and AI visibility. Every price checked November 1, 2026.Read guide →
 SEO & AI Search12 Best Platforms for Accurate AI Search Data in 2026, ComparedThe best platform for accurate AI search data: 12 tools compared on price, prompt coverage and how each proves its numbers. Prices checked October 31, 2026.Read guide →
 AI SearchBest AI SEO tools in 2026: honest picks by jobBest AI SEO tools in 2026, picked by job: Semrush and Ahrefs for research, Surfer and Clearscope for content, Otterly for AI tracking, with 2026 prices.Read guide →