8 Best Infrastructure Monitoring Software in 2026, Compared
Compare the 8 best infrastructure monitoring software on host pricing, free tiers, open-source options and real monthly cost for servers, checked in 2026.
 Shamim Mia, Founder, SerpAstraLast verified November 7, 20269 min read
We compare pricing pages, documentation and public reviews. We never accept payment for rankings.
Key takeaways
- Datadog is the default pick for cloud teams: Infrastructure Pro costs $15 per host a month billed annually, or $18 on demand, with a free tier for five hosts.
- New Relic and Grafana Cloud do not charge per host: New Relic bills by data and users with 100 GB a month free, and Grafana Cloud Pro starts at a $19 platform fee.
- Zabbix and Checkmk Community are free to self-host, which suits on-premises estates with someone to run them.
- For IT teams that also cover networks and hybrid estates, LogicMonitor starts at $19 per Hybrid Unit a month and Site24x7 at $9 a month.
On this page
Quick comparison
| Tool | Best for | Starting price | Free plan |
|---|---|---|---|
| Datadog Infrastructure Monitoring | Cloud and container teams that want hosts, containers, APM and logs in one SaaS platform | Free; $15/host/mo | Yes (5 hosts) |
| New Relic | Teams with many hosts and few engineers who want pricing by data and users rather than by host | Free; $0.40/GB | Yes (100 GB/mo) |
| Grafana Cloud | Teams that already use Prometheus and Grafana dashboards and want a hosted, usage-priced stack | Free; Pro $19/mo + usage | Yes (10k series) |
| Dynatrace | Large enterprises that want automatic discovery and AI root-cause analysis across hybrid estates | $29/host/mo | No (15-day trial) |
| LogicMonitor | IT operations teams that monitor on-premises servers, network gear and cloud from one SaaS console | From $19/unit/mo | No (14-day trial) |
| Zabbix | On-premises IT teams that want free, open-source monitoring for servers, networks and databases | Free | Yes (open source) |
| Checkmk | Mid-size IT teams that want a free self-hosted start and predictable per-service pricing later | Free; Pro €190/mo | Yes (Community) |
| Site24x7 | Small IT teams that want server, website and network monitoring at a low monthly price | $9/mo | Yes (free plan) |
Make one of these tools?
We re-check this list every quarter. Send a correction, request a review, or ask about a clearly labeled sponsored spot.
Request a listingThe best infrastructure monitoring software

Datadog Infrastructure Monitoring
Best for: Cloud and container teams that want hosts, containers, APM and logs in one SaaS platform
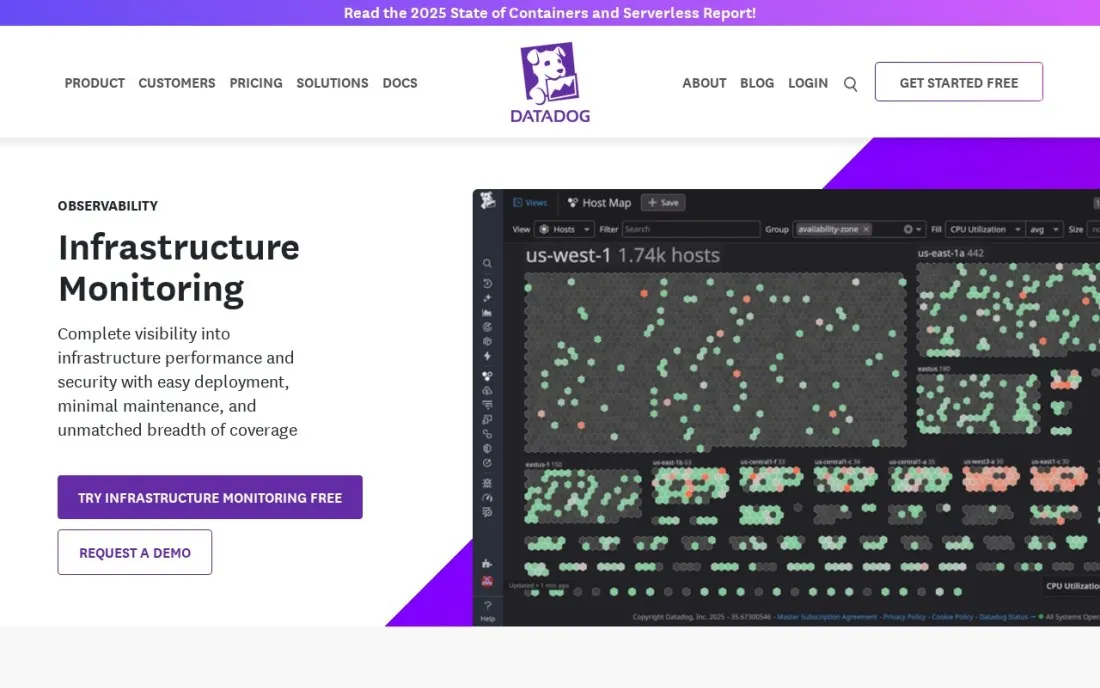
Datadog is the platform most cloud teams shortlist first. One agent on each host reports metrics, processes and containers to dashboards and alerts, and the same agent can switch on APM, log collection and security monitoring later, so the stack grows without another tool. Pro costs $15 a host a month billed annually, or $18 on demand, and includes 5 containers and 100 custom metrics per host; Enterprise costs $23 billed annually.
The bill is the thing to watch. Each product is priced separately, so APM at $31 a host a month billed annually more than doubles the per-host cost, and extra containers are $0.002 an hour each. The free tier covers five hosts but keeps metrics for one day.
What we like
- Published per-host prices: Pro $15 and Enterprise $23 a host a month billed annually
- Pro includes 5 containers and 100 custom metrics per host
- APM, logs and security add onto the same agent and dashboards
Watch out for
- Costs stack quickly: APM adds $31 a host a month billed annually on top of infrastructure
- The free tier keeps metrics for only one day
- Extra containers and custom metrics are billed beyond the included amounts

New Relic
Best for: Teams with many hosts and few engineers who want pricing by data and users rather than by host
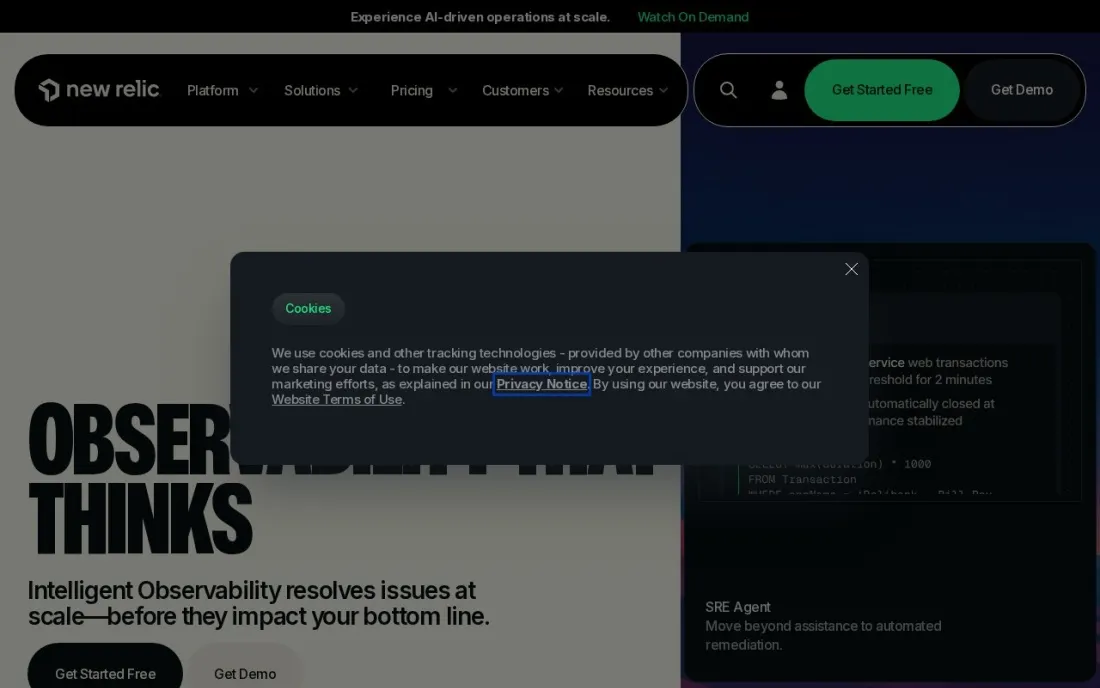
New Relic prices observability by data and people, not by host, which changes the maths for estates with many small servers. Every account gets 100 GB of data ingest a month free, one full platform user and unlimited basic users, and data beyond that costs $0.40 a GB on the original data option. Standard charges $10 for the first full platform user and $99 for each additional one, up to five.
The user side is where large teams pay. Pro full platform users cost $349 a month each on an annual commitment, or $418.80 pay-as-you-go. On the free tier, ingest stops at 100 GB until the month resets, so set a data alert early.
What we like
- Hosts are not counted — you pay for data ingested and for users
- Free tier with 100 GB of ingest a month and one full platform user
- Standard's first full platform user costs $10 a month
Watch out for
- Pro full platform users cost $349 a month each on an annual commitment
- On the free tier, ingest stops when you pass 100 GB until the next month

Grafana Cloud
Best for: Teams that already use Prometheus and Grafana dashboards and want a hosted, usage-priced stack
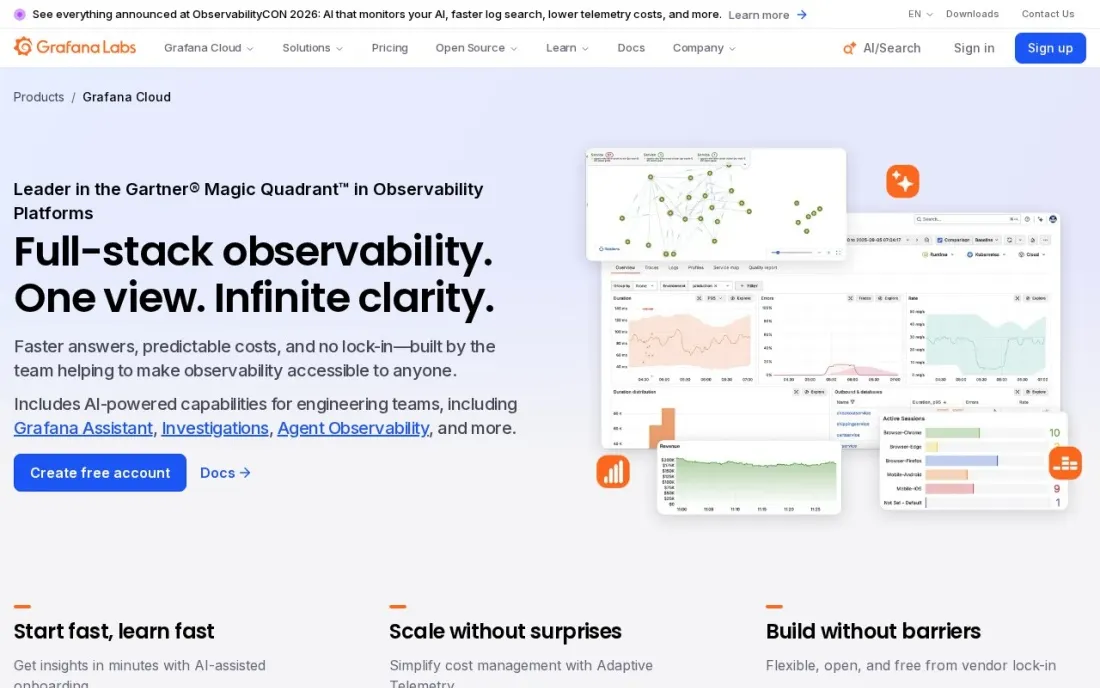
Grafana Cloud is the hosted version of the open-source stack many engineers already run: Prometheus-style metrics, Loki logs, Tempo traces and Grafana dashboards. The free tier is the most generous in this list, with 10,000 active metric series, 50 GB each of logs and traces a month, 14-day retention and three users. Kubernetes monitoring hours are included too.
Pro costs a $19 monthly platform fee plus usage: metrics from $6.50 per 1,000 series after the included 10,000, and logs from $0.40 a GB written plus processing and retention fees. Metrics are kept 13 months. Enterprise starts at a $25,000 annual commit.
What we like
- Generous free tier: 10k metric series and 50 GB of logs and traces a month
- Built on open-source Prometheus, Loki and Tempo, so data and dashboards stay portable
- Pro keeps metrics 13 months for a $19 platform fee plus usage
Watch out for
- Usage pricing across series, GB processed, written and retained takes effort to forecast
- Enterprise needs a $25,000-a-year minimum commit

Dynatrace
Best for: Large enterprises that want automatic discovery and AI root-cause analysis across hybrid estates
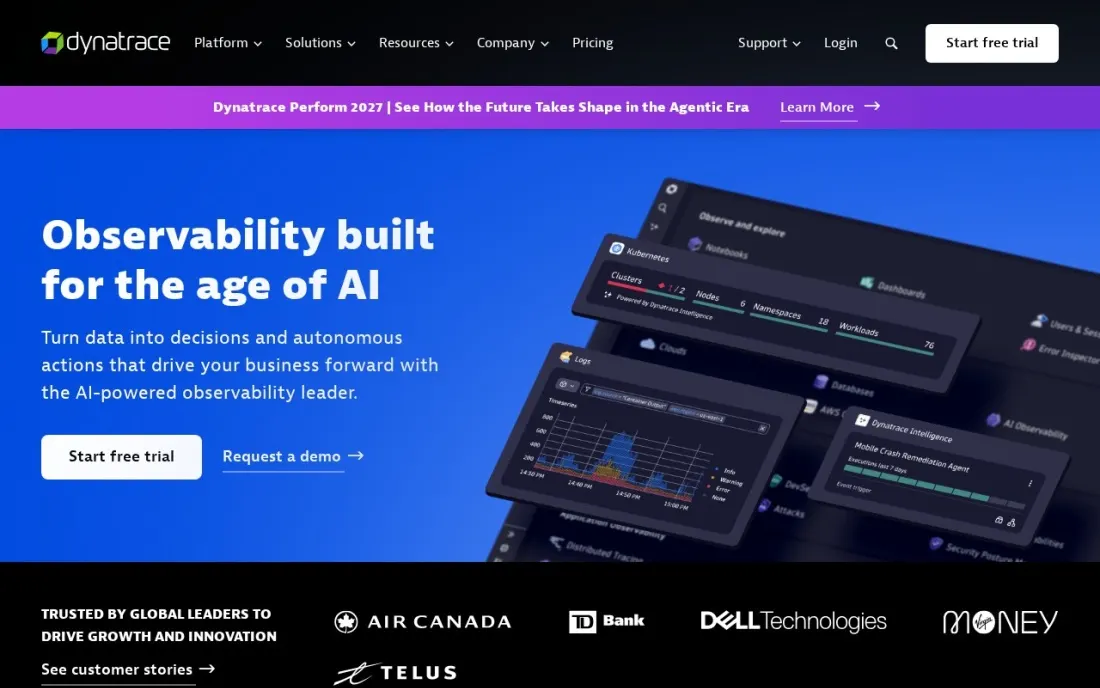
Dynatrace is built for large estates where nobody can draw the dependency map by hand. Its agent discovers hosts, processes and services automatically, maps how they connect and uses that model to point at the likely root cause when something breaks. Infrastructure Monitoring costs $29 a host a month, billed at $0.04 per host-hour, and Full-Stack Monitoring with application tracing costs $58 a month per 8 GiB host.
It is not a small-team tool. The rate card sits behind a minimum annual commitment whose amount Dynatrace does not publish, and the 15-day trial is the only free route. Choose it when the cost of a long outage is far larger than the licence.
What we like
- Published hourly rate card: Infrastructure Monitoring at $0.04 per host-hour
- Full-Stack Monitoring adds application tracing at $58 a month per 8 GiB host
- Log analytics priced per GiB with a pay-per-query option
Watch out for
- A minimum annual platform commitment applies, with the amount not published
- Highest per-host infrastructure price of the SaaS tools here

LogicMonitor
Best for: IT operations teams that monitor on-premises servers, network gear and cloud from one SaaS console
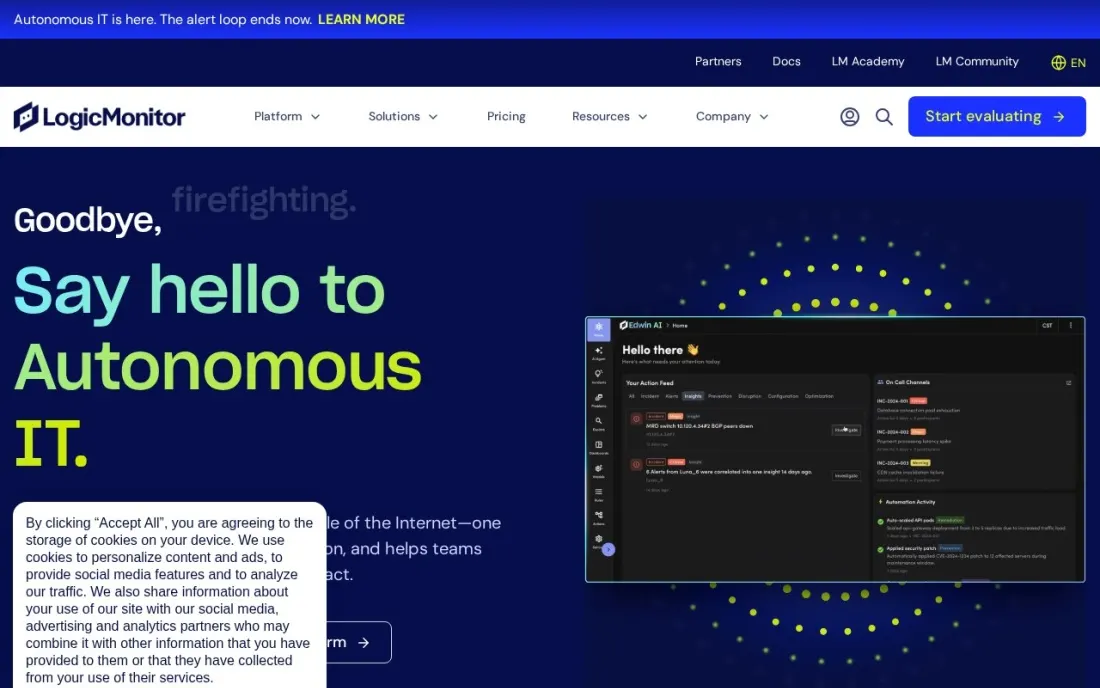
LogicMonitor suits IT operations teams whose estate mixes data-centre servers, switches and firewalls with cloud. Collectors pick up on-premises devices without an agent on each one, and the same console covers cloud and PaaS resources. Pricing is by Hybrid Unit: one unit equals one collector-monitored device, one cloud instance, seven PaaS resources or five wireless access points.
Essentials starts at $19 per unit a month, Advanced at $37 and Signature at $50, all list prices before volume and contract terms, so you still need a quote. Logs are a feature without a published price. The 14-day trial covers any plan.
What we like
- One Hybrid Unit covers an on-prem device, a cloud instance or seven PaaS resources
- Starting list prices published for all three packages
- Sandbox portal included for up to 10% of paid capacity
Watch out for
- Final cost depends on volume and contract terms, so a quote is still needed
- Log pricing is not published

Zabbix
Best for: On-premises IT teams that want free, open-source monitoring for servers, networks and databases
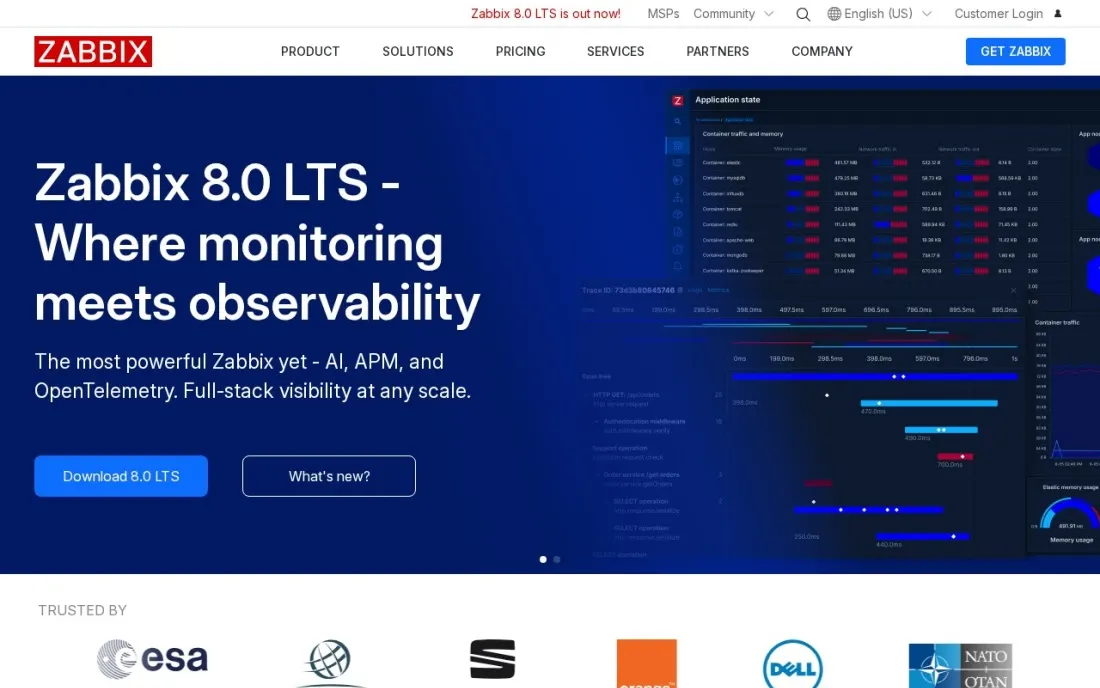
Zabbix is the free answer for teams that keep their infrastructure on-premises. It is open source under AGPLv3 from version 7.0, with no licence fee, and one install can watch Linux and Windows servers, network devices over SNMP, virtual machines and databases, with templates for common hardware and alerting rules you set yourself.
Free means your team does the running: installing the server and database, scaling them as the host count grows, and keeping templates current. Zabbix asks commercial users to buy a support subscription and also sells a hosted Zabbix Cloud, but neither price appears on a public list, so ask for a quote.
What we like
- No licence fee — open source under AGPLv3 from version 7.0
- Monitors servers, network devices, virtual machines and databases from one install
- Paid support, training and a hosted Zabbix Cloud are available if you need them
Watch out for
- Your team installs, scales and maintains the server and database
- Prices for support and Zabbix Cloud are not shown on a public price list

Checkmk
Best for: Mid-size IT teams that want a free self-hosted start and predictable per-service pricing later
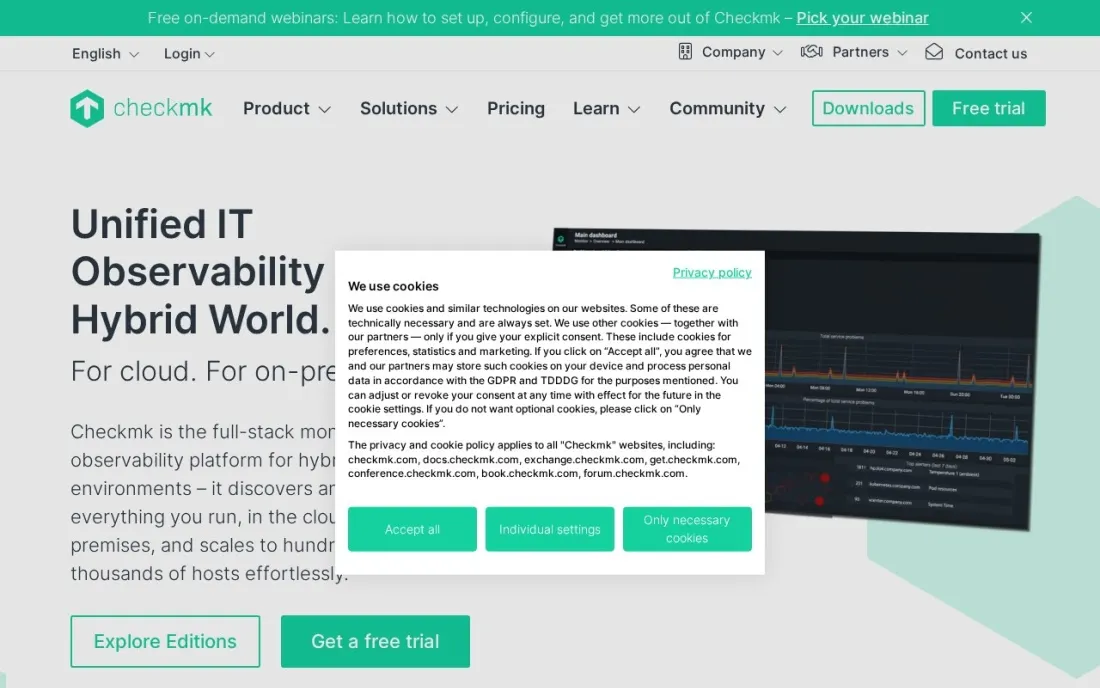
Checkmk sits between free open source and enterprise SaaS. The Community edition is self-hosted and free for roughly 100 hosts, and auto-discovery finds the services on each host so setup is quicker than building checks by hand. Pro starts at €190 a month billed annually, about €1.90 per host at entry, and Ultimate at €275 a month.
Pricing is per service, and Checkmk puts the average host at about 30 services, so count before you buy. The hosted Cloud edition starts at €240 a month for 1,000 services. When a Pro trial ends, the install falls back to a free mode with 750 services, and self-hosted sites cannot move to Cloud.
What we like
- Free Community edition for roughly 100 hosts
- Pro from €190 a month billed annually, about €1.90 per host at entry
- 30-day trials of Pro, Ultimate and the hosted Cloud edition
Watch out for
- Priced per service, with about 30 services per host, so sizing takes care
- Prices are in euros, and self-hosted sites cannot migrate to Cloud

Site24x7
Best for: Small IT teams that want server, website and network monitoring at a low monthly price
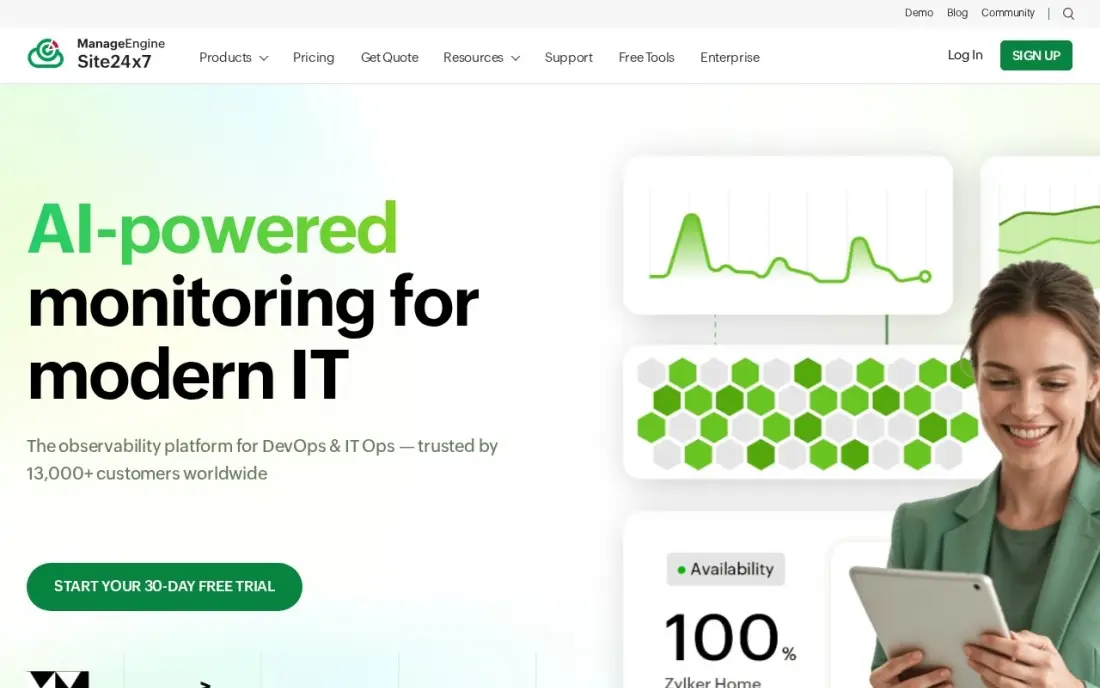
Site24x7, from the Zoho and ManageEngine family, is the budget all-rounder here. One console covers websites, servers, networks and cloud, with checks every minute from more than 130 locations and alerts by email, SMS and chat. Paid plans start at $9 a month, with 10% off billed annually, and the free plan covers five monitors.
The $9 plan is mainly web uptime; server, network and application monitoring sit on higher plans, so price the plan that includes your servers. It watches and alerts but does not fix anything on its own. Every paid plan has a 30-day trial.
What we like
- Website, server, network and cloud monitoring in one console from $9/month
- Checks run every minute from 130+ locations, with instant alerts by email, SMS and chat
- Free plan covers 5 monitors, and every paid plan includes a 30-day free trial
- Part of the Zoho and ManageEngine family, the budget all-rounder in this list
Watch out for
- The free plan's 5 monitors cover only a handful of servers or sites
- The $9 plan covers web uptime; server, network and application monitoring cost more
- Alerting needs someone to act on it — there is no automated remediation on the entry plan
The best infrastructure monitoring software tells you that a server is running out of disk, a container is restarting or a database host is saturated before users notice, and shows enough history to explain why. We compared eight tools across SaaS platforms, hybrid IT monitoring and free open-source options, covering what most IT departments call IT monitoring too, and every price below was checked on the vendor's own pricing page in November 2026.
How to choose the best infrastructure monitoring software
- Match the tool to where your servers live. Cloud and Kubernetes estates suit agent-based SaaS; data centres full of switches and storage need agentless collectors and SNMP.
- Understand the billing unit. Per host, per Hybrid Unit, per service, per GB and per user all appear here, and the cheapest list price can become the dearest at your scale.
- Check retention. One day of metrics on a free tier is fine for alerts but useless for capacity planning; look for 13 to 15 months on paid plans.
- Look at alert routing. Alerts should reach the on-call person in chat, SMS or a paging tool, with thresholds you can tune to stop noise.
- Plan for logs and traces. If you will add APM or log analysis later, a platform that does both avoids a second agent and a second bill.
- Count who will run it. Free self-hosted tools save licence fees but need an owner for upgrades, storage and scaling.
Monitoring keeps the servers healthy; it does not tell you whether the site those servers host is visible in search. If your team runs the company website, our SEO audit checks crawlability and speed problems that monitoring dashboards miss, and the free robots.txt tester confirms search engines can reach the right pages.
Infrastructure monitoring software pricing: what you will actually pay
Take 20 cloud hosts running containers. On Datadog Infrastructure Pro at $15 a host a month billed annually, that is $300 a month, or $3,600 a year; on demand it is $18 a host, $360 a month. Adding APM at $31 a host billed annually brings the total to $920 a month. Dynatrace Infrastructure Monitoring at $29 a host a month costs $580 a month for the same 20 hosts, and Full-Stack at $58 per 8 GiB host costs $1,160 a month, before the minimum annual commitment.
The usage-priced tools work differently. On New Relic, a small team that stays under 100 GB of ingest a month with one full platform user pays $0; going to Standard with three full users costs $10 plus two at $99, $208 a month, plus $0.40 a GB above 100 GB. Grafana Cloud Pro starts at $19 a month plus usage above the free 10,000 metric series. LogicMonitor Essentials at $19 per Hybrid Unit puts 20 hosts at about $380 a month before discounts, and Checkmk Pro starts at €190 a month billed annually. Zabbix and Checkmk Community cost nothing in licences but need a server and someone to run it.
Know the difference: SaaS monitoring vs self-hosted monitoring
SaaS monitoring — Datadog, New Relic, Grafana Cloud, Dynatrace, LogicMonitor and Site24x7 — runs the storage, dashboards and alerting for you. You install an agent or collector, and the vendor handles scaling, upgrades and retention. The trade is cost that grows with every host, gigabyte or user, and monitoring data held outside your network.
Self-hosted monitoring — Zabbix and Checkmk's self-hosted editions — puts the server on your own hardware. There is no licence fee for Zabbix or Checkmk Community, data stays on site, and nothing changes when you add hosts except the hardware you need. The trade is staff time: someone patches the server, sizes the database and keeps templates current. Teams with strict data rules or mostly on-premises equipment often find that trade worthwhile; cloud-native teams rarely do.
Quick comparison: tool type by need
| Buyer | Best pick | Why |
|---|---|---|
| Cloud and container teams | Datadog Infrastructure Monitoring | $15/host/month billed annually, free for 5 hosts |
| Many hosts, small team | New Relic | No host pricing; 100 GB/month and 1 full user free |
| Prometheus and Grafana users | Grafana Cloud | Largest free tier; Pro $19/month plus usage |
| Large hybrid enterprises | Dynatrace | Automatic discovery and root cause, $29/host/month |
| IT ops with on-prem and cloud | LogicMonitor | Agentless collectors, from $19 per Hybrid Unit/month |
| Free and on-premises | Zabbix | Open source under AGPLv3, no licence fee |
| Free start, paid later | Checkmk | Community free for ~100 hosts; Pro from €190/month |
| Small IT team on a budget | Site24x7 | Servers, sites and networks from $9/month, free for 5 monitors |
Mistakes to avoid
- Alerting on everything. Hundreds of default alerts teach the team to ignore them; start with a few that mean a user is affected.
- Ignoring custom metric and container overages. Per-host prices include a set number of containers and custom metrics, and the extras appear on the bill later.
- Running free monitoring on the server it watches. If the monitoring box goes down with the estate, you learn about the outage from users.
- Buying APM, logs and infrastructure from three vendors by accident. Three agents and three bills cost more than one platform that covers the stack.
- Keeping too little history. Capacity planning needs months of data; check paid retention before you commit.
Related comparisons: Web Monitoring Software · Employee Monitoring Software · Apps for Crop Monitoring · AI Search Monitoring Tools for Agencies
How we chose
We read each vendor's own pricing page in November 2026 and recorded prices exactly as listed, separating annual and on-demand rates and noting the billing unit, because per-host, per-unit, per-service and per-GB prices cannot be compared directly. Checkmk lists prices in euros, which we kept. We ranked by fit for a team running between ten and a few hundred servers across cloud and on-premises. Ratings come from G2 where we checked the page, on the dates shown. No vendor paid for a place in this list, and none of the links here are affiliate links.
What to do next
Count your hosts, containers and log volume, then run two free tiers side by side for a week — one per-host SaaS tool and one usage-priced or self-hosted option — and compare the alerts you actually acted on. If the website on those servers also needs to rank, book a free SEO review.
Frequently asked questions
What is the best infrastructure monitoring software?
Datadog is the best fit for most cloud teams, with Infrastructure Pro at $15 per host a month billed annually and a free tier for five hosts. Grafana Cloud and New Relic suit teams that prefer usage pricing, and Zabbix and Checkmk are the best free self-hosted options.
Is there free infrastructure monitoring software?
Yes. Zabbix is open source under AGPLv3 with no licence fee, Checkmk Community is free for about 100 hosts, Grafana Cloud's free tier covers 10,000 metric series and 50 GB of logs a month, New Relic includes 100 GB of ingest a month free, and Datadog is free for five hosts with one-day retention.
How much does infrastructure monitoring cost per server?
On published rates, Datadog Pro costs $15 a host a month billed annually, Dynatrace Infrastructure Monitoring $29 a host a month and LogicMonitor Essentials from $19 per Hybrid Unit a month. New Relic and Grafana Cloud charge by data rather than host.
What is the difference between infrastructure monitoring and APM?
Infrastructure monitoring watches the machines: CPU, memory, disk, network and containers. APM watches the application running on them: request latency, errors and slow database calls. Datadog sells them as separate per-host products, while Dynatrace's Full-Stack Monitoring bundles both.
Is IT monitoring the same as infrastructure monitoring?
Mostly. IT monitoring usually means the same servers and networks plus end-user devices and business services. Tools such as LogicMonitor, Zabbix, Checkmk and Site24x7 cover servers and network devices together, which is what most IT departments mean by IT monitoring.
Should I choose SaaS or self-hosted monitoring?
SaaS tools such as Datadog, New Relic and Grafana Cloud remove the work of running the monitoring server. Self-hosted Zabbix and Checkmk cost nothing in licences and keep data on your network, but someone has to maintain them.
What is the best system monitoring software for Linux and Windows servers?
Zabbix is the strongest free choice: one install watches Linux and Windows servers, network devices over SNMP, virtual machines and databases, with no licence fee. Checkmk Community is free for about 100 hosts if you want per-service pricing later. For cloud servers, Datadog is free for five hosts and $15 a host a month after that, and Site24x7 starts at $9 a month.
Sources we checked (9)
- Datadog Infrastructure Monitoring — www.datadoghq.com/pricing (checked November 16, 2026)
- New Relic — newrelic.com/pricing (checked November 16, 2026)
- Grafana Cloud — grafana.com/pricing (checked November 16, 2026)
- Dynatrace — www.dynatrace.com/pricing (checked November 16, 2026)
- LogicMonitor — www.logicmonitor.com/pricing (checked November 16, 2026)
- Zabbix — www.zabbix.com/license (checked November 16, 2026)
- Checkmk — checkmk.com/pricing (checked November 16, 2026)
- Site24x7 — www.site24x7.com/site24x7-pricing.html (checked November 7, 2026)
- Site24x7 reviews on G2 (checked November 7, 2026)
Make one of these tools?
We re-check this list every quarter. Send a correction, request a review, or ask about a clearly labeled sponsored spot.
Request a listingShamim
Founder of SerpAstra
A full-stack digital marketer and SEO strategist covering technical and local SEO, AI search visibility, paid ads and lead generation for local businesses, e-commerce brands and SaaS teams.
Free SEO and AI visibility audit
Find out what is holding your rankings back
Send us your site. Within 2 business days you get a written audit, an AI visibility check and a short fix list ranked by impact. Free, with no contract attached.
Request my free audit→Related buying guides
 IT Management6 Best Network Management Software in 2026, ComparedCompare the 6 best network management software on monitoring, device discovery, free editions and real cost per sensor, site or device, checked on vendor pages.Read guide →
 IT Management6 Best Web Monitoring Software in 2026, ComparedCompare the 6 best web monitoring software on uptime checks, check intervals, alerts, status pages, free plans and real monthly cost, with prices checked.Read guide →
 IT Management7 Best IT Management Software in 2026, ComparedCompare the 7 best IT management software for endpoints, service desks, monitoring and IT assets, with free editions and real per-device costs checked.Read guide →